


Close Menu
  • Main Home
  • About
    • Founder & CEO
    • The Challenge
    • Testimonials
    • In the Media
    • Gray Rhino® Trademark Guidelines
    • Contact
  • Services
    • Speaking
    • Speaking Topics
      • TOP GLOBAL ECONOMY GRAY RHINOS
      • CLIMATE RISK GRAY RHINOS: STRATEGIC RESPONSES
      • GENDER AND RISK
      • THE RISK YOUR “FREE-FROM” FOOD BRAND CANNOT AFFORD TO TAKE
    • Workshop and Interactive Training Topics
      • RISK SKILLS IN THE FUTURE OF WORK
      • RISK FINGERPRINT FORENSICS
      • GRAY RHINO PROOFING YOUR FUTURE
    • Executive Masterclass – Risk Management
    • DCRO Risk Governance Institute
    • Earn the Mastering Gray Rhino® Governance Certificate
    • Strategic Advisory
    • NEW Microlearning Course: What’s Your Gray Rhino? [Personal version]
  • THE GRAY RHINO
    • Corporate Book Clubs
    • International Editions
      • Italian -Il Rinoceronte Grigio
      • Brazilian Portuguese -O Rinoceronte Cinza
      • Norwegian: GRÅ NESHORN
      • 灰犀牛 (Chinese Traditional Characters)
      • 灰犀牛 (Chinese Simplified Characters)
      • Korean: 회색 코뿔소가 온다
      • Hungarian: A szürke rinocérosz
    • Readers Guide
      • Media
  • YOU ARE WHAT YOU RISK
  • Gray Rhino Blog
    • The Horn
    • My Gray Rhino
    • Audio
    • Video
Facebook X (Twitter) Instagram
Trending
  • Constructing cognitive models using the gray rhino risk framework
  • Substack Gray Rhino Wrangler Short Series: the Big Ugly Debt Gray Rhino
  • Kerala’s Landslide Grey Rhino
  • IRM India Affiliate’s What’s the Risk?®️ – National Resilience In The Age of Polycrisis
  • Earn the Mastering Gray Rhino® Governance Certificate
  • The Gray Rhino microlearning course (personal version)
  • ARK Wealth Summit Hong Kong 2025: Reshaping Risk Awareness
  • On Substack: Wrangling this Gray Rhino Rampage
Facebook LinkedIn RSS
Gray Rhino & Company
Leaderboard Ad
  • Main Home
  • About
    • Founder & CEO
    • The Challenge
    • Testimonials
    • In the Media
    • Gray Rhino® Trademark Guidelines
    • Contact
  • Services
    • Speaking
    • Speaking Topics
      • TOP GLOBAL ECONOMY GRAY RHINOS
      • CLIMATE RISK GRAY RHINOS: STRATEGIC RESPONSES
      • GENDER AND RISK
      • THE RISK YOUR “FREE-FROM” FOOD BRAND CANNOT AFFORD TO TAKE
    • Workshop and Interactive Training Topics
      • RISK SKILLS IN THE FUTURE OF WORK
      • RISK FINGERPRINT FORENSICS
      • GRAY RHINO PROOFING YOUR FUTURE
    • Executive Masterclass – Risk Management
    • DCRO Risk Governance Institute
    • Earn the Mastering Gray Rhino® Governance Certificate
    • Strategic Advisory
    • NEW Microlearning Course: What’s Your Gray Rhino? [Personal version]
  • THE GRAY RHINO
    • Corporate Book Clubs
    • International Editions
      • Italian -Il Rinoceronte Grigio
      • Brazilian Portuguese -O Rinoceronte Cinza
      • Norwegian: GRÅ NESHORN
      • 灰犀牛 (Chinese Traditional Characters)
      • 灰犀牛 (Chinese Simplified Characters)
      • Korean: 회색 코뿔소가 온다
      • Hungarian: A szürke rinocérosz
    • Readers Guide
      • Media
  • YOU ARE WHAT YOU RISK
  • Gray Rhino Blog
    • The Horn
    • My Gray Rhino
    • Audio
    • Video
Gray Rhino & Company
You are at:Home»Global»How to Spot a Bubble
Photo by Frank Black Noir
Photo by Frank Black Noir (pompa HDR) via flickr/Creative Commons (CC BY 2.0) https://creativecommons.org/licenses/by/2.0/

How to Spot a Bubble

0
By Brian Barnier on March 5, 2018 Global, The Horn

 Editor’s note: The early February market correction prompted debate over whether stocks were merely experiencing a technical correction or had farther to go. We immediately thought of a 2016 Fed Dashboard analysis by Brian Barnier that made a simple but powerful point: to understand if something is a bubble or not, we have to ask “relative to what”? In this special guest commentary, he kindly updated his analysis with more recent data.


“No one can see a bubble, that’s why it’s called a bubble” is a myth. Just like the ones kids blow on a summer day, bubbles are bubbles relative to a reference point — like the base of a kid’s bubble pipe. Similarly, financial asset bubbles are revealed when compared to tangibles, such as sales or assets.

Kids are good at spotting the unusual – like the biggest cookie compared to others. Because children focus on comparisons, we should think like them when trying to spot financial bubbles.

A financial bubble is born when the price of a financial claim (e.g., stock or bond) exceeds the value of the tangible (e.g., hard asset or cash flow) to which it lays claim. Price increases are easy to see. But the real question is whether a tangible change in underlying conditions justifies that price increase. So we spot financial bubbles by understanding causes.

Historically, bubbles tend to be brewed by some combination of excessive optimism and liquidity. That liquidity might flow from tangible economic health, monetary policy or credit.

Pure financial bubbles are relatively easy to see because the underlying tangible asset really doesn’t change. Instead there is a cash flow to that asset class. Causes of these inflows tend to be either “follow the leader” or “flee the fear.”

  • “Follow the leader” bubbles tend to originate in government tax, spending, regulatory or monetary policy. The mortgage bubble was an example, caused by tax-deductible mortgage interest, subsidies to housing and encouraging low income home ownership. The current U.S. equity bubble started with the Federal Reserve (Fed) seeking to create a “wealth effect” that it hoped would encourage broader spending and investment. But that didn’t happen. Follow the leader can also be caused by retail investor exuberance (as before the Great Recession) or trader herd mentality.
  • “Flee from fear” bubbles are often caused by geopolitical events and policies that trigger people to seek safety. Safety in recent years has included U.S. Treasuries and equities.

To spot a financial bubble, we follow these three steps:

  1. Compare a financial asset measure to more tangible values such as sales, production or nonfinancial assets.
  2. Determine causes of past moves and use scenarios to discover new causes.
  3. Use measures of risk matched to the nature of risk. For example, as we’ve written in the past, don’t use linear statistical measures such as correlations on nonlinear data. Value at Risk models (which estimate how much investment prices might drop given normal market conditions at a set probability) rely too heavily on trading history and mostly ignore causes and deeper trends.

Evaluating “excessive optimism” requires another step – considering whether that optimism is backward or forward-looking.

  • Backward-looking optimism kicks in when we try to make predictions about whether a past, tangible growth rate will continue. Past growth can be anything from what European trading powers experienced in the 1600s to optimistic statements from a few years ago that S&P500 companies could continue to cost-cut their way to growing EPS. Digging through layers of causes is rewarding for those who take the time.
  • Forward-looking optimism is more difficult because it requires valuing tangible assets and cash flows that are contingent on business outcomes like new technology achieving design objectives, market development or competitive survival. The South Sea, railroad, telecom and dot-com bubbles had this in common.
    • Political analysis is needed when causes are related to government policy such as U.K. debt with the South Sea bubble, and U.S. regulatory policy with railroads and telecom.
    • Company-specific analysis is needed to find winners and losers as in railroads, telecom and dot-com.
    • These bubbles can spur innovation in trade and/or technology. When they are fueled by more cash than credit, the bubble bursting does relatively little economic damage. This explains the difference between the consequences in 1999, when wider economic damage was limited, and the devastating impact in 2008, when the credit-fueled mortgage bubble burst.

Fed Dashboard has previously illustrated several kinds of bubbles. For the mortgage bubble, the site highlighted the “Treacherous Triangle” pattern. Fed Dashboard also illustrated fundamental bubbles in the Market Fundamentals section, often with visualizations from Zacks Research System.

The broadest level measure of a bubble is the strain gauge ratio of public equity market levels to business production. It reflects how far equity market prices strain above the value of the tangible goods and services market. Just as the valuation of a retail store can be excessive for a given level of sales, this shows how far stock market valuations can exceed the performance of companies and the economy.
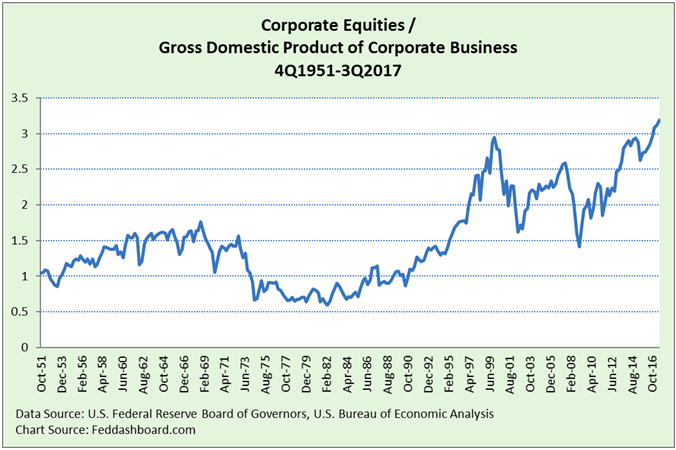
The chart above shows the 3Q2017 view based on recent stock market indices divided by gross business value.

An important difference between 2018 and 1999 is that today’s bubble is far broader than tech companies. This means more investors will get hurt if this ends badly.

Some critics of this particular strain gauge argue that it is effectively a price/sales ratio for U.S. corporate business and that price/earnings ratio is a better comparison. Three responses:

  • Critics offered the same argument several years ago, coupled with forecasts that EPS growth would continue and cost cutting would drive top-line growth. Both of those forecasts have been proven false.
  • The price/earnings ratio was never logically valid as an appropriate measure because it excluded change in growth rates and included the fallacy of past performance. (You can read more on this point at “To find better measures of value, look beyond broadsheet relics.”)
  • Even if price/earnings ratio were perfect at a company level, it’s wrong to use as a measure for the economy as a whole. Why? In the circular flow of our economy, sales enable business to pay wages and buy inputs from other businesses.

There are three ways this bubble could resolve, as FedDashboard discussed in 2014.

  • Tangible economic growth reducing the strain without the need for equity prices to fall. This was the Fed’s hope when they created their “wealth effect.”
  • Rapid decompression due to
    • Market: insufficient liquidity or inability to deliver securities
    • Strain exposed, spooking traders, especially as traders are uncertain how to read these markets
  • Slow leak due to
    • Interest rates — affects on savers and debtors
    • Households — demographics, savings, medical & more costs
    • Business — cash haves and have-nots
    • Scarce resource (commodities and input goods) — differential affects on prices
    • Government — debt and regulation
    • Geopolitical and pandemic

Summing this up, we leave you with three takeaways on the market outlook, what it means for the Fed, and what it means for investors.

How far might the market fall?

  • Looking only at the tech and mortgage bubbles bursting, both fell to the high side of 1960s levels on the Strain Gauge.
  • Other factors that will shape the fall include:
    1) memories of protection provided by the 2008 bailouts,
    2) central bank “puts” to “backstop” the markets, most recently reinforced by the Bank of England,
    3) how recently revised derivative contract language, accounting rules and regulation will interact under strain (a topic with far too little study), and
    4) which trading approaches will dominate in times of stress and how those traders will interact in their prisoner’s dilemma.
  • Glean clues to the future by studying any unusual volatility.

What does this mean for the Fed?

  • Recognize the magnitude of the current bubble and normalize monetary policy without increasing bubble risk

Finally, what does this mean for investors?

  • Think like a kid when evaluating bubbles – compare to an underlying, more tangible measure of value
  • Revise asset allocations using strain gauges and scenarios that include the triggers listed above
  • At the sector level, be alert for sentiment traders increasing bubbles with rotations unsupported by fundamentals
  • Change to risk measures that are appropriate to the data pattern (e.g., nonlinear), and potential causes of slow leak in or bursting of a bubble
  • Study volatility for clues to what might happen in “the big one.”

This post has been updated and adapted from Fed Dashboard and Fundamentals with the author’s permission.

  • Author
  • Recent Posts
Brian Barnier
Follow Brian
Brian Barnier
Director/Head of Analytics at ValueBridge Advisors (U.S.)/Burnt Oak Capital (UK)
Brian Barnier brings practical insight to help investors, boards and management bridge from strategy to execution. He accelerates business results improvements through a "risk lens" that incorporates both growth and turnaround lessons learned across industries, professional disciplines and countries. He is the author of The Operational Handbook for Financial Companies (Harriman House, Great Britain, 2011), and a contributor to Risk Management in Finance (Wiley, 2009) and Risk and Performance Management: A Guide for Government Decision Makers (Wiley, 2014). Widely quoted in the financial media, he is a founder and editor of Fed Dashboard and Fundamentals, dedicated to busting economic and market risk myths.
Brian Barnier
Follow Brian
Latest posts by Brian Barnier (see all)
  • How to Spot a Bubble - March 5, 2018
Brian Barnier bubble Fed Dashboard Federal Reserve financial markets
Share. Facebook Twitter Pinterest LinkedIn Tumblr Email
Brian Barnier
  • Website
  • X (Twitter)
  • LinkedIn

Related Posts

Substack Gray Rhino Wrangler Short Series: the Big Ugly Debt Gray Rhino

On Substack: Wrangling this Gray Rhino Rampage

Gray Rhino Risks and Responses to Watch in 2024

Comments are closed.

YOU ARE WHAT YOU RISK
YOU ARE WHAT YOU RISK Book Cover Click to order YOU ARE WHAT YOU RISK: The New Art and Science of Navigating an Uncertain World (Pegasus Books, April 6, 2021)
Book A Keynote or Workshop
Speakers Connect Sidebar Ad Book Gray Rhino & Company Founder & CEO Michele Wucker to speak at your next event. For more information  click on the logo  to contact Speakersconnect.

DCROI Risk Governance Institute
DCROI logo NEW! Earn the Mastering Gray Rhino Governance Certificate. Learn about DCROI's growing library of courses, networking, learning, and development opportunities focusing on the positive governance of risk-taking and the practical aspects of risk governance needed to pursue corporate goals and fulfill the purpose of our organizations.
BOOKSHOP.ORG STORE
Bookshop.org logo Shop at Bookshop.org and support independent booksellers. Browse our lists on business, decision making, current affairs, and more.
Leaderboard Ad
About
About

Gray Rhino® & Company provides a simple yet powerful framework, training and tools to help individuals, organizations, and communities to better counter and overcome obvious but too often neglected challenges in business, life, and the world.

Facebook LinkedIn
GRAY RHINO TRACKER Sign Up
Subscribe below for exclusive insights and updates in our monthly newsletter, The Gray Rhino® Tracker.

©2016-2026
Gray Rhino & Company
5940 North Broadway
Chicago, IL 60660

Gray Rhino® is a registered trademark of Gray Rhino & Company.

  • About
  • Privacy Policy
  • Contact
©2016-2023 Gray Rhino & Company 5940 North Sheridan Road, Chicago, IL 60660
  • About
  • Privacy Policy
  • Contact

Type above and press Enter to search. Press Esc to cancel.

We use cookies on our website to give you the most relevant experience by remembering your preferences and repeat visits. By clicking “Accept”, you consent to the use of ALL the cookies.
Do not sell my personal information.
Cookie SettingsAccept
Manage consent

Privacy Overview

This website uses cookies to improve your experience while you navigate through the website. Out of these, the cookies that are categorized as necessary are stored on your browser as they are essential for the working of basic functionalities of the website. We also use third-party cookies that help us analyze and understand how you use this website. These cookies will be stored in your browser only with your consent. You also have the option to opt-out of these cookies. But opting out of some of these cookies may affect your browsing experience.
Necessary
Always Enabled
Necessary cookies are absolutely essential for the website to function properly. These cookies ensure basic functionalities and security features of the website, anonymously.
CookieDurationDescription
cookielawinfo-checkbox-analytics11 monthsThis cookie is set by GDPR Cookie Consent plugin. The cookie is used to store the user consent for the cookies in the category "Analytics".
cookielawinfo-checkbox-functional11 monthsThe cookie is set by GDPR cookie consent to record the user consent for the cookies in the category "Functional".
cookielawinfo-checkbox-necessary11 monthsThis cookie is set by GDPR Cookie Consent plugin. The cookies is used to store the user consent for the cookies in the category "Necessary".
cookielawinfo-checkbox-others11 monthsThis cookie is set by GDPR Cookie Consent plugin. The cookie is used to store the user consent for the cookies in the category "Other.
cookielawinfo-checkbox-performance11 monthsThis cookie is set by GDPR Cookie Consent plugin. The cookie is used to store the user consent for the cookies in the category "Performance".
viewed_cookie_policy11 monthsThe cookie is set by the GDPR Cookie Consent plugin and is used to store whether or not user has consented to the use of cookies. It does not store any personal data.
Functional
Functional cookies help to perform certain functionalities like sharing the content of the website on social media platforms, collect feedbacks, and other third-party features.
Performance
Performance cookies are used to understand and analyze the key performance indexes of the website which helps in delivering a better user experience for the visitors.
Analytics
Analytical cookies are used to understand how visitors interact with the website. These cookies help provide information on metrics the number of visitors, bounce rate, traffic source, etc.
Advertisement
Advertisement cookies are used to provide visitors with relevant ads and marketing campaigns. These cookies track visitors across websites and collect information to provide customized ads.
Others
Other uncategorized cookies are those that are being analyzed and have not been classified into a category as yet.
SAVE & ACCEPT